I’m struggling to create a network heat map for my project. I need to visualize the traffic across different nodes in my network, but I’m not sure what tools or software to use. Can someone recommend the best way to go about this?
Hey there, regarding generating a network heat map, I totally get the frustration. Here’s what might help:
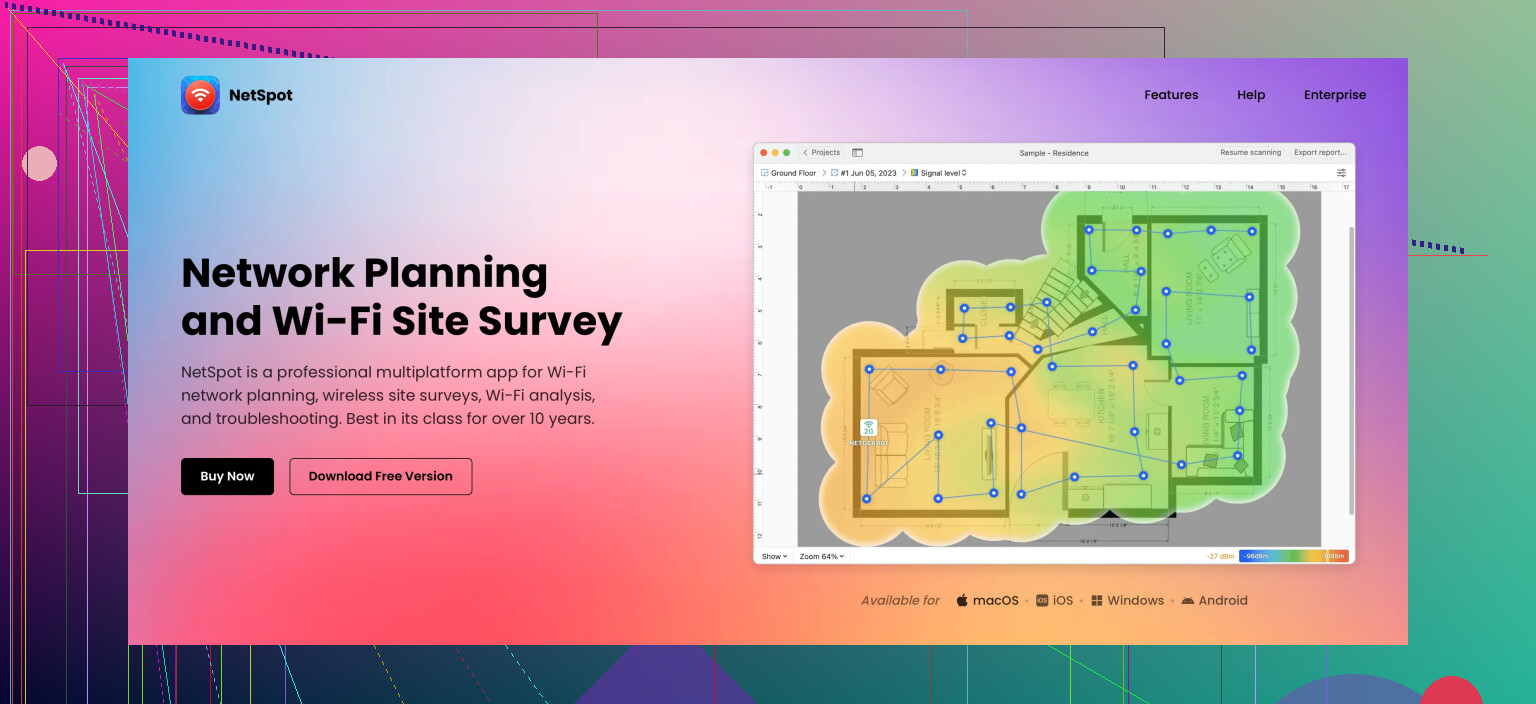
- Netspot: It’s a solid tool for visualizing WiFi coverage. Dead simple to use and gives you lots of insights about network performance. You can check it out here.
-
PRTG Network Monitor: PRTG also offers heat maps. It’s a bit complex but highly customizable for in-depth network analysis.
-
Ekahau HeatMapper: Specifically for WiFi, it’s really straightforward. You can visualize and understand how traffic flows through your network.
Remember, a lot of it depends on what exactly you need and your technical level. Netspot is a great starting point due to its ease of use and accessible reporting. It’s often mentioned in network forums for good reasons. Give that a shot first, and see where it takes you!
I totally get where you’re coming from. Creating a network heat map can be tricky if you’re not sure about the right tools. While @hoshikuzu mentioned some great options, I’d like to throw in a couple more suggestions that might fit different needs or preferences.
1. Zabbix: If you’re looking for an open-source solution, Zabbix is highly configurable and free. It might take some time to set up, but it offers robust data visualization capabilities, including network traffic heat maps.
2. Nagios XI: Another fantastic tool, especially if you’re managing a large network. It’s highly scalable and provides detailed traffic insights. It’s a bit complex to get started with, similar to PRTG, but the customization options are endless.
3. Wireshark + Grafana: For a custom solution, you could use Wireshark to capture network data and Grafana to visualize it. This combo is more hands-on and requires some setup, but it offers unparalleled flexibility.
4. OpManager: ManageEngine’s OpManager is an all-in-one network management tool that offers heat maps and a plethora of other monitoring features. It’s user-friendly and quite powerful.
Now, a little aside to @hoshikuzu’s list - while Netspot is fantastic for WiFi visualization, if you’re diving deeper into wired network traffic visualization, you might find tools like Zabbix more fitting. It’s always good to match the tool to the specific needs of your network environment.
Top WiFi Heatmap Software
Finding the best WiFi heatmap software can be a game-changer for optimizing your network. From visualizing coverage gaps to pinpointing performance bottlenecks, the right tool provides invaluable insights. Dive into our comprehensive guide to discover the leading options available, ensuring seamless and efficient WiFi performance.
14 Likes
Greate ah, a tough one indeed! While @sterrenkijker and @hoshikuzu have laid out some excellent options, let me add a bit to the mix. If you’re struggling to create a network heat map, don’t overlook these pointers:
First off, if you’re specifically after WiFi heat maps, Netspot can be a superb initiation point. It’s intuitive, making it accessible even to those who aren’t super tech-geeky. The biggest advantage is its ease of use—you practically need zero technical background to get started. On the downside, it’s somewhat limited to WiFi networks, so it might not offer the most comprehensive insights if you’re also dealing with a wired network.
Expanding beyond that, another noteworthy tool to consider is Intermapper. It offers robust network mapping and traffic visualization. Although it’s a bit less user-friendly than Netspot, it compensates with deeper analytical capabilities ideal for complex network setups.
Cisco Prime is another enterprise-level tool worth mentioning. It’s quite powerful and suitable for large-scale networks, but be warned, the learning curve can be steep, and the cost might not be justifiable for smaller projects.
For those who prefer an open-source route, MRTG (Multi Router Traffic Grapher) can be a great addition. It’s not as polished as some commercial options, but it’s highly customizable and free. It’s more hands-on, giving you flexibility at the cost of ease of use.
Lastly, for DIY enthusiasts, consider combining netdata with Grafana for real-time network monitoring and visualization. This setup is not for the faint-hearted but allows for unparalleled flexibility.
Netspot Pros:
- User-friendly and intuitive
- Excellent WiFi visualization
- Quick deployment
Netspot Cons:
- Limited to WiFi networks
- Not as analytical as some enterprise tools
Competitors from @sterrenkijker and @hoshikuzu like Zabbix and SolarWinds can be ideal if you’re willing to invest in a steeper learning curve for a more comprehensive solution. However, for immediate, user-friendly results, Netspot is often tough to beat.
Keep in mind, the best tool largely depends on your specific needs and technical comfort level. While it can be tempting to go with the most powerful option available, sometimes a simpler tool like Netspot can provide the exact solutions without overwhelming you.